> ## Documentation Index
> Fetch the complete documentation index at: https://mcpjam-mintlify-docs-update-pr-3829-1786337254828.mintlify.site/llms.txt
> Use this file to discover all available pages before exploring further.
# MCP Inspector
> Manually test your MCP server's tools, resources, and prompts
The MCP Inspector provides a complete testing environment for your MCP server. Manually invoke tools, read resources, fetch prompts, and view all JSON-RPC messages between MCPJam and your server.
The Tools, Resources, and Prompts tabs only load data when the selected server
is connected. If the server is disconnected, the tabs clear any previously
loaded primitives and display a prompt to reconnect. Refresh, run, and read
actions are disabled until the server is connected again.
 ## Tools
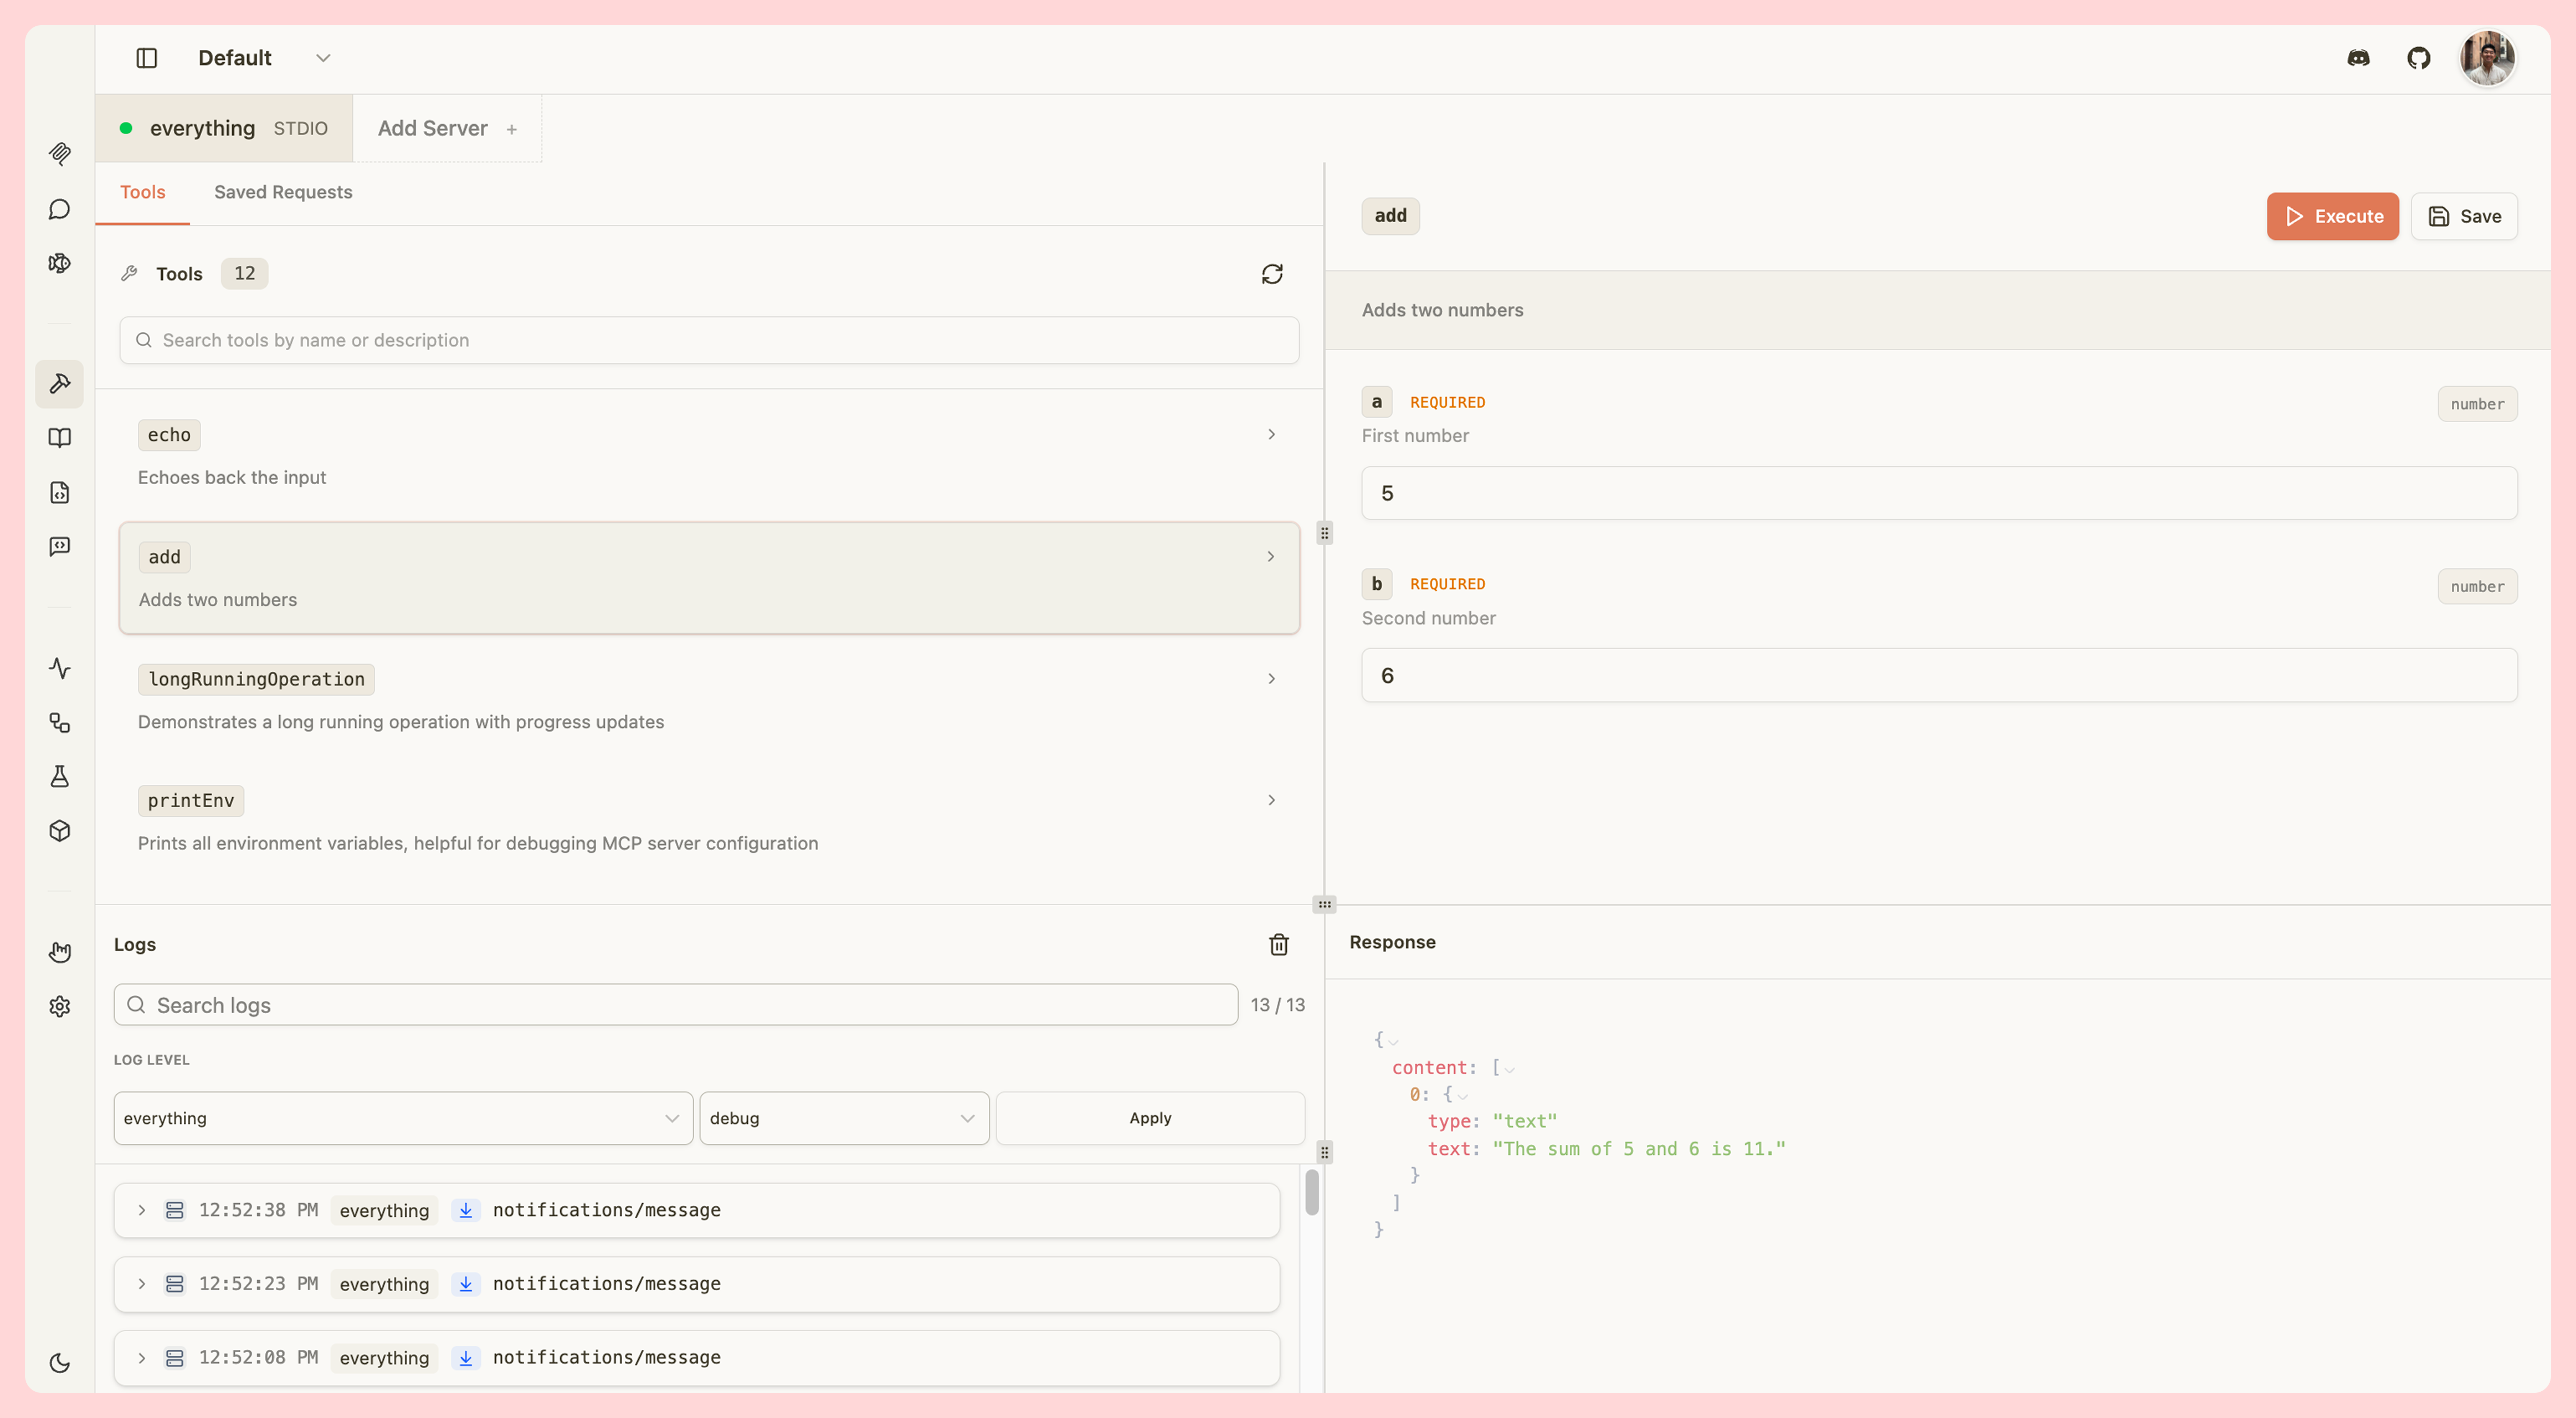
Test your MCP tools by manually invoking them with custom parameters:
* **View all tools** - Browse tool names, descriptions, and parameters
* **Search tools** - Quickly find specific tools by name
* **Invoke tools** - Trigger tools with custom input parameters
* **View results** - See tool outputs, including widget responses for ChatGPT apps and MCP apps
* **Elicitation support** - Handle elicitation requests from tools with a spec-complete form dialog
* **Multi-round input** - Tools that return `input_required` (MCP 2026-07-28) collect the needed input through the same dialog and retry automatically
* **Save requests** - Save frequently used tool invocations for quick testing
* **Quality badges** - See per-tool quality indicators in the sidebar for tools with definition issues
### Elicitation requests
When a tool triggers an MCP elicitation request, a dialog appears asking you to provide additional input. The dialog renders a form built from the server's schema and supports the full MCP elicitation subset:
* **Field labels and defaults** — Fields show the schema `title` when provided (the raw property key stays visible alongside it). Schema `default` values are pre-filled automatically.
* **Field types** — Strings, numbers, integers, booleans (checkbox), single-select dropdowns, and multi-select checkbox lists are all rendered natively. Fields with `format: email`, `uri`, `date`, or `date-time` use the matching browser input type.
* **Inline validation** — Clicking **Accept** validates all fields before submitting. Required fields, numeric `minimum`/`maximum`, string `minLength`/`maxLength`, `pattern`, and format constraints are all checked. Errors appear under the relevant field and block submission until resolved.
* **Server identity** — The dialog header identifies which server is requesting information. When the server supplies both a name and an ID, both are shown — the ID is the trusted anchor and is always visible.
* **Unsupported shapes** — Nested objects and other schema shapes outside the MCP elicitation spec fall back to a plain JSON textarea so you can still answer by hand.
**Decline** and **Cancel** are always available and bypass validation — they send the corresponding action to the server without any parameters.
### Multi-round input (MCP 2026-07-28 `input_required`)
When a tool call returns an `input_required` result (MCP 2026-07-28 §12), the inspector collects the embedded elicitation input through the same dialog and automatically retries the original call with your answers. This is distinct from the legacy `elicitation/create` flow:
* **Dialog title** — shows "Operation Needs Input" (vs "Elicitation Request" for legacy requests).
* **Dialog header** — reads "\[server] needs input to continue" (vs "\[server] is requesting information").
* **Multiple keys per round** — if the server embeds more than one input request in a single round, the dialog walks through them one at a time and submits all answers together.
* **Automatic retry** — after you respond, the inspector retries the original `tools/call` with your answers attached. You do not need to re-invoke the tool manually.
* **Decline and Cancel** — send the corresponding action back to the server; the server decides whether to abort or continue.
This behavior applies to local connections. The inspector must be connected to the server before the tool is invoked; the `elicitation` capability is advertised at connect time.
### OAuth scope step-up on tool calls
When a tool call returns a `403 insufficient_scope` error, the Tools tab automatically triggers a re-authorization flow. Inspector unions the scopes from your original OAuth grant with the scopes the server challenged, then redirects you to the authorization server to approve the expanded set. After you return from the consent screen, re-run the tool.
The step-up is bounded per browser session: if re-authorization does not resolve the scope error after the allowed number of attempts, Inspector surfaces the error instead of redirecting again. The counter resets when a tool call succeeds, so a future legitimate scope challenge starts fresh. Opening a new browser session also resets the counter.
Runtime scope step-up is only available on the local (non-hosted) tool-call surface. The hosted path does not yet forward the scope challenge.
### Tool quality badges
When enabled, each tool in the sidebar may display a small badge showing the number of quality findings for that tool:
| Badge color | Meaning |
| ----------- | ----------------------------------------------------------------------------------------------------------------------------------------------------------------- |
| Red | A spec-level error (for example, `inputSchema` missing or not an object) |
| Amber | A quality warning (for example, undocumented parameters, a description referencing a parameter not in the schema, or a `required` name missing from `properties`) |
Hover over a badge to see the full list of findings. Tools with no issues show no badge.
Saved requests are stored in your browser's local storage and accessible from the Saved Requests tab.
## Resources
Inspect your MCP server's resources:
* **Browse resources** - View all available resources with names, URIs, and MIME types
* **Read resources** - Fetch and view resource content
* **Resource templates** - Test templated resources with dynamic parameters
* **Multi-round input** - Resources that return `input_required` (MCP 2026-07-28) collect the needed input through the elicitation dialog and retry the read automatically
### Subscription stream panel
When connected to a local server, the Resources tab shows a **Subscriptions** panel at the bottom. The panel lets you observe and control the subscription lifecycle the local manager owns.
The subscription panel is only available in local (non-hosted) mode and only when a server is connected.
The panel branches on the negotiated protocol era:
**Modern era (`subscriptions/listen`, MCP 2026-07-28)**
The server supports a single `subscriptions/listen` stream. Because a listen filter is immutable for the life of a subscription, changing the desired filter closes the current stream and opens a new one automatically. The panel shows:
* **Desired filter** — checkboxes for `tools/list_changed`, `prompts/list_changed`, and `resources/list_changed`, plus per-URI watch toggles for each resource. Toggling any checkbox posts the new desired interests; the coordinator performs the close and reopen.
* **Stream details** — status (`Opening`, `Active`, `Closed by server (graceful)`, `Connection lost (remote close)`, `Cancelled locally`, `Error`), the MCP subscription id and whether it was `reported` or `observed`, the requested filter next to the acknowledged filter, any interests the server did not honor, the close reason, and the re-listen attempt count.
* **Cancel stream** — ends the current stream as a local abort.
**Legacy era (`resources/subscribe`)**
The server uses per-URI subscribe RPCs. The panel shows the same stream details but replaces the desired-filter checkboxes with per-URI **Subscribe** / **Unsubscribe** buttons backed by `resources/subscribe` and `resources/unsubscribe`.
**History**
Both eras append a History log below the stream list. Each entry records the kind of transition:
| Entry kind | Meaning |
| ----------------- | ----------------------------------------------------------------------- |
| `opened` | A new stream was requested |
| `acknowledged` | The server confirmed the filter |
| `reconnected` | A re-listen attempt was made |
| `closed-graceful` | The server closed the stream gracefully |
| `closed-remote` | The connection was lost (remote close) |
| `cancelled` | The stream was cancelled locally |
| `error` | The stream ended with an error |
| `notification` | A subscription notification arrived |
| `rejected` | A notification arrived for an interest the server did not agree to send |
Graceful and remote closes are always distinct entries — they are never flattened into a single "disconnected" event. Rejected notifications are shown rather than silently dropped, so you can see the absence the server chose.
## Prompts
Test your MCP prompts:
* **View prompts** - Browse prompt names, descriptions, and parameters
* **Fetch prompts** - Retrieve prompt content with custom arguments
* **Use in Playground** - Type `/` in the Playground to insert prompts directly into the conversation
* **Multi-round input** - Prompts that return `input_required` (MCP 2026-07-28) collect the needed input through the elicitation dialog and retry the fetch automatically
## JSON-RPC Logging
All communication between MCPJam and your MCP server is logged in real-time:
* **Request/response pairs** - View complete JSON-RPC messages
* **Message types** - See tool calls, resource reads, prompt fetches, and more
* **Error tracking** - Inspect errors and validation issues
* **Timestamps** - Track message timing and performance
The JSON-RPC logger helps you debug your MCP server implementation and understand the complete protocol flow.
### Inline HTTP headers
When you expand an outgoing JSON-RPC frame (a request sent to the server), a collapsed **HTTP headers** section appears below the JSON body. Expanding it shows the full HTTP exchange — request headers, response status, and any `Mcp-*` headers the server mirrored back.
The collapsed row names the first disagreement without requiring you to open anything: for example, `mcp-name disagrees with the body` tells you which header caused a routing failure before you inspect the exchange in detail. The row turns red when the exchange returned a 4xx/5xx status or the connection failed at the transport level.
`Mcp-Param-*` rows are judged too, whenever the log holds a `tools/list` for the tool: each mirrored argument shows ✓ when the header matches the value in the request body, and a failure verdict when it disagrees, was never sent, or names a parameter the tool never declared. When the tool's schema can't be recovered from the log the row says `unchecked — tool schema unavailable`, so an unverifiable header never reads as a passing one.
The section is absent when no exchange could be confidently matched to the frame, and hidden entirely when the exchange carries no cross-checked `Mcp-*` headers (for example, connections to servers running a protocol era before 2026-07-28).
The dedicated **HTTP** source filter in the traffic log still shows every exchange on its own terms, including ones that carry no single JSON-RPC frame.
### OAuth log entries
When a server uses OAuth, each step of the OAuth flow appears as a log entry in the traffic log alongside regular JSON-RPC messages. Use the **Source** filter dropdown and select **OAuth** to show only OAuth entries.
Each OAuth log entry displays a status indicator:
| Indicator | Meaning |
| --------- | ---------------------------------------------------------------------------- |
| `oauth ✓` | Step completed successfully |
| `oauth ✗` | Step failed |
| `oauth …` | Step is in progress |
| `oauth ↺` | Step failed but was recovered (for example, after re-registering the client) |
Click any entry to expand it and inspect the full step payload, including HTTP request and response details.
## Tools
Test your MCP tools by manually invoking them with custom parameters:
* **View all tools** - Browse tool names, descriptions, and parameters
* **Search tools** - Quickly find specific tools by name
* **Invoke tools** - Trigger tools with custom input parameters
* **View results** - See tool outputs, including widget responses for ChatGPT apps and MCP apps
* **Elicitation support** - Handle elicitation requests from tools with a spec-complete form dialog
* **Multi-round input** - Tools that return `input_required` (MCP 2026-07-28) collect the needed input through the same dialog and retry automatically
* **Save requests** - Save frequently used tool invocations for quick testing
* **Quality badges** - See per-tool quality indicators in the sidebar for tools with definition issues
### Elicitation requests
When a tool triggers an MCP elicitation request, a dialog appears asking you to provide additional input. The dialog renders a form built from the server's schema and supports the full MCP elicitation subset:
* **Field labels and defaults** — Fields show the schema `title` when provided (the raw property key stays visible alongside it). Schema `default` values are pre-filled automatically.
* **Field types** — Strings, numbers, integers, booleans (checkbox), single-select dropdowns, and multi-select checkbox lists are all rendered natively. Fields with `format: email`, `uri`, `date`, or `date-time` use the matching browser input type.
* **Inline validation** — Clicking **Accept** validates all fields before submitting. Required fields, numeric `minimum`/`maximum`, string `minLength`/`maxLength`, `pattern`, and format constraints are all checked. Errors appear under the relevant field and block submission until resolved.
* **Server identity** — The dialog header identifies which server is requesting information. When the server supplies both a name and an ID, both are shown — the ID is the trusted anchor and is always visible.
* **Unsupported shapes** — Nested objects and other schema shapes outside the MCP elicitation spec fall back to a plain JSON textarea so you can still answer by hand.
**Decline** and **Cancel** are always available and bypass validation — they send the corresponding action to the server without any parameters.
### Multi-round input (MCP 2026-07-28 `input_required`)
When a tool call returns an `input_required` result (MCP 2026-07-28 §12), the inspector collects the embedded elicitation input through the same dialog and automatically retries the original call with your answers. This is distinct from the legacy `elicitation/create` flow:
* **Dialog title** — shows "Operation Needs Input" (vs "Elicitation Request" for legacy requests).
* **Dialog header** — reads "\[server] needs input to continue" (vs "\[server] is requesting information").
* **Multiple keys per round** — if the server embeds more than one input request in a single round, the dialog walks through them one at a time and submits all answers together.
* **Automatic retry** — after you respond, the inspector retries the original `tools/call` with your answers attached. You do not need to re-invoke the tool manually.
* **Decline and Cancel** — send the corresponding action back to the server; the server decides whether to abort or continue.
This behavior applies to local connections. The inspector must be connected to the server before the tool is invoked; the `elicitation` capability is advertised at connect time.
### OAuth scope step-up on tool calls
When a tool call returns a `403 insufficient_scope` error, the Tools tab automatically triggers a re-authorization flow. Inspector unions the scopes from your original OAuth grant with the scopes the server challenged, then redirects you to the authorization server to approve the expanded set. After you return from the consent screen, re-run the tool.
The step-up is bounded per browser session: if re-authorization does not resolve the scope error after the allowed number of attempts, Inspector surfaces the error instead of redirecting again. The counter resets when a tool call succeeds, so a future legitimate scope challenge starts fresh. Opening a new browser session also resets the counter.
Runtime scope step-up is only available on the local (non-hosted) tool-call surface. The hosted path does not yet forward the scope challenge.
### Tool quality badges
When enabled, each tool in the sidebar may display a small badge showing the number of quality findings for that tool:
| Badge color | Meaning |
| ----------- | ----------------------------------------------------------------------------------------------------------------------------------------------------------------- |
| Red | A spec-level error (for example, `inputSchema` missing or not an object) |
| Amber | A quality warning (for example, undocumented parameters, a description referencing a parameter not in the schema, or a `required` name missing from `properties`) |
Hover over a badge to see the full list of findings. Tools with no issues show no badge.
Saved requests are stored in your browser's local storage and accessible from the Saved Requests tab.
## Resources
Inspect your MCP server's resources:
* **Browse resources** - View all available resources with names, URIs, and MIME types
* **Read resources** - Fetch and view resource content
* **Resource templates** - Test templated resources with dynamic parameters
* **Multi-round input** - Resources that return `input_required` (MCP 2026-07-28) collect the needed input through the elicitation dialog and retry the read automatically
### Subscription stream panel
When connected to a local server, the Resources tab shows a **Subscriptions** panel at the bottom. The panel lets you observe and control the subscription lifecycle the local manager owns.
The subscription panel is only available in local (non-hosted) mode and only when a server is connected.
The panel branches on the negotiated protocol era:
**Modern era (`subscriptions/listen`, MCP 2026-07-28)**
The server supports a single `subscriptions/listen` stream. Because a listen filter is immutable for the life of a subscription, changing the desired filter closes the current stream and opens a new one automatically. The panel shows:
* **Desired filter** — checkboxes for `tools/list_changed`, `prompts/list_changed`, and `resources/list_changed`, plus per-URI watch toggles for each resource. Toggling any checkbox posts the new desired interests; the coordinator performs the close and reopen.
* **Stream details** — status (`Opening`, `Active`, `Closed by server (graceful)`, `Connection lost (remote close)`, `Cancelled locally`, `Error`), the MCP subscription id and whether it was `reported` or `observed`, the requested filter next to the acknowledged filter, any interests the server did not honor, the close reason, and the re-listen attempt count.
* **Cancel stream** — ends the current stream as a local abort.
**Legacy era (`resources/subscribe`)**
The server uses per-URI subscribe RPCs. The panel shows the same stream details but replaces the desired-filter checkboxes with per-URI **Subscribe** / **Unsubscribe** buttons backed by `resources/subscribe` and `resources/unsubscribe`.
**History**
Both eras append a History log below the stream list. Each entry records the kind of transition:
| Entry kind | Meaning |
| ----------------- | ----------------------------------------------------------------------- |
| `opened` | A new stream was requested |
| `acknowledged` | The server confirmed the filter |
| `reconnected` | A re-listen attempt was made |
| `closed-graceful` | The server closed the stream gracefully |
| `closed-remote` | The connection was lost (remote close) |
| `cancelled` | The stream was cancelled locally |
| `error` | The stream ended with an error |
| `notification` | A subscription notification arrived |
| `rejected` | A notification arrived for an interest the server did not agree to send |
Graceful and remote closes are always distinct entries — they are never flattened into a single "disconnected" event. Rejected notifications are shown rather than silently dropped, so you can see the absence the server chose.
## Prompts
Test your MCP prompts:
* **View prompts** - Browse prompt names, descriptions, and parameters
* **Fetch prompts** - Retrieve prompt content with custom arguments
* **Use in Playground** - Type `/` in the Playground to insert prompts directly into the conversation
* **Multi-round input** - Prompts that return `input_required` (MCP 2026-07-28) collect the needed input through the elicitation dialog and retry the fetch automatically
## JSON-RPC Logging
All communication between MCPJam and your MCP server is logged in real-time:
* **Request/response pairs** - View complete JSON-RPC messages
* **Message types** - See tool calls, resource reads, prompt fetches, and more
* **Error tracking** - Inspect errors and validation issues
* **Timestamps** - Track message timing and performance
The JSON-RPC logger helps you debug your MCP server implementation and understand the complete protocol flow.
### Inline HTTP headers
When you expand an outgoing JSON-RPC frame (a request sent to the server), a collapsed **HTTP headers** section appears below the JSON body. Expanding it shows the full HTTP exchange — request headers, response status, and any `Mcp-*` headers the server mirrored back.
The collapsed row names the first disagreement without requiring you to open anything: for example, `mcp-name disagrees with the body` tells you which header caused a routing failure before you inspect the exchange in detail. The row turns red when the exchange returned a 4xx/5xx status or the connection failed at the transport level.
`Mcp-Param-*` rows are judged too, whenever the log holds a `tools/list` for the tool: each mirrored argument shows ✓ when the header matches the value in the request body, and a failure verdict when it disagrees, was never sent, or names a parameter the tool never declared. When the tool's schema can't be recovered from the log the row says `unchecked — tool schema unavailable`, so an unverifiable header never reads as a passing one.
The section is absent when no exchange could be confidently matched to the frame, and hidden entirely when the exchange carries no cross-checked `Mcp-*` headers (for example, connections to servers running a protocol era before 2026-07-28).
The dedicated **HTTP** source filter in the traffic log still shows every exchange on its own terms, including ones that carry no single JSON-RPC frame.
### OAuth log entries
When a server uses OAuth, each step of the OAuth flow appears as a log entry in the traffic log alongside regular JSON-RPC messages. Use the **Source** filter dropdown and select **OAuth** to show only OAuth entries.
Each OAuth log entry displays a status indicator:
| Indicator | Meaning |
| --------- | ---------------------------------------------------------------------------- |
| `oauth ✓` | Step completed successfully |
| `oauth ✗` | Step failed |
| `oauth …` | Step is in progress |
| `oauth ↺` | Step failed but was recovered (for example, after re-registering the client) |
Click any entry to expand it and inspect the full step payload, including HTTP request and response details.